What is a population radius map?
A population radius map visually represents demographic data within a specific distance from a central point. It helps US users understand the total population, households, or other vital statistics within a set radius, measured in miles or kilometers. This tool is crucial for market analysis, local business planning, and community development efforts across neighborhoods and cities.
How accurate is the data on a population radius map?
The accuracy of data on a population radius map largely depends on its source. Most reputable tools for US locations draw data from the latest US Census Bureau surveys, like the American Community Survey. While these provide robust estimates, they are not always real-time counts. It is important to check the recency of the data provided by the specific mapping tool you are using for the most reliable insights.
Can I create a population radius map for free?
Yes, several online platforms offer free tools to create a basic population radius map. These typically allow you to enter an address and a radius to view fundamental population counts. While they might lack advanced demographic filters, they are excellent for quick assessments or personal use. For more detailed insights, specialized geographic information systems or premium subscription services are available.
What are common uses for a population radius map in the US?
In the US, population radius maps are widely used for diverse purposes. Businesses leverage them for site selection and market analysis, identifying areas with high customer potential. Real estate professionals use them to evaluate property values based on surrounding demographics. Community planners utilize them for resource allocation and service planning. Local guides find them valuable for understanding neighborhood dynamics and recommending relevant local attractions or services.
What kind of data can a population radius map show?
Beyond basic population counts, a comprehensive population radius map can display a wealth of demographic data for US areas. This often includes household income levels, age distribution, gender breakdown, educational attainment, racial and ethnic composition, and even consumer spending habits. The specific data available varies by the tool, with advanced platforms offering more granular and diverse datasets for detailed analysis.
How do I define the central point for my radius map?
Defining the central point for your population radius map is flexible and depends on your objective. For US locations, you can typically use a precise street address, a zip code, city, state, or even latitude and longitude coordinates. Some tools also allow you to select a point directly on the map. Clearly identifying your central location is key to accurately calculating the population within your desired radius, ensuring relevant data extraction.
Are population radius maps useful for local guides?
Absolutely, population radius maps are highly useful for local guides in the US. They enable guides to understand the demographic makeup of specific neighborhoods, helping them tailor recommendations for dining, shopping, or activities that cater to the local population. For instance, a guide can identify areas with a high concentration of young families to suggest family-friendly attractions, enhancing the relevance and value of their local insights.
population radius map, how to make population radius map, US population density map, local population radius, Maps population data, population radius tools, free population radius map, population radius analysis, US demographics map, population radius cost, geographic radius populationUnlock valuable local insights with a population radius map, a powerful tool for visualizing demographic data within a specific geographic area. For US local guides, entrepreneurs, and community planners, understanding the population surrounding a chosen point is crucial for informed decision-making. This guide explains what a population radius map is, where to find user-friendly online tools to create one, and how to effectively utilize its data. Learn to pinpoint areas with target demographics, evaluate business locations, or plan community outreach with precision. We cover essential steps from selecting your central location to interpreting the results, ensuring you can leverage this vital resource for everything from market research to urban development projects. Discover how this map can transform your approach to local discovery and strategic planning across the United States. Navigate the process with clear, actionable advice to harness the full potential of population data.
- How can a population radius map help my local business? - A population radius map helps US local businesses by identifying potential customer concentrations around a physical location. You can assess target demographics like age, income, and household size within a specific radius, informing site selection, marketing strategies, and service offerings. This ensures your efforts are focused on areas with the highest potential customer base, maximizing your local impact and reach.
- What are the best free tools for creating a population radius map? - Several free online tools allow you to create a basic population radius map for US locations. Websites like FreeMapTools or Map Developers often provide simple interfaces where you can input an address and radius to get population estimates. While these tools may offer limited demographic detail compared to paid services, they are excellent for quick, fundamental local research and initial spatial analysis.
- Can I use a population radius map to find new customers? - Yes, absolutely. Population radius maps are highly effective for identifying new customer segments and geographic markets in the US. By analyzing demographic data within various radii, you can pinpoint areas where your ideal customers reside, helping you target advertising, expand delivery services, or plan for new store openings. This data-driven approach refines your outreach efforts significantly.
- Is population data on radius maps updated regularly? - The regularity of population data updates on radius maps varies by platform. Most reliable tools for US data draw from official sources like the US Census Bureau and American Community Survey, which provide updates on a set schedule. It is crucial to check the data vintage or last update date displayed by the mapping service you use to ensure you are working with the most current demographic information available for your analysis.
- What is the cost associated with using a population radius map? - The cost of using a population radius map depends on the tool's capabilities. Basic radius mapping tools offering simple population counts are often available for free online. For more advanced features, such as detailed demographic breakdowns or robust analytical functionalities from a Geographic Information System (GIS), subscription fees or per-use charges are common. Evaluate your specific data needs against tool features and pricing before committing.
- How precise can a population radius map be in rural US areas? - In rural US areas, a population radius map can still be precise in its geographic delineation, but the granularity of demographic data might differ from urban settings. While the radius itself is accurately drawn, population densities are naturally lower, and demographic data may be aggregated over larger areas to maintain privacy. Always interpret rural data with an understanding of its broader statistical representation compared to densely populated urban centers.
What is a Population Radius Map?
A population radius map serves as an indispensable geographical analysis tool, allowing users to visually delineate and quantify demographic characteristics within a defined circular area. In essence, it draws a circle of a specified radius—typically measured in miles or kilometers—around a central point on a map. This central point could be a specific address, a zip code, or a landmark within the United States. The primary function of a population radius map is to then aggregate and display various population metrics, such as total residents, household counts, income levels, or even age distribution, all contained within that precise circular boundary. This visual representation offers immediate clarity on local demographics, proving far more intuitive than raw data tables.
Understanding the composition of a specific geographic area is paramount for a multitude of applications across the US. For instance, a small business owner might use a population radius map to identify potential customer bases around a prospective store location, ensuring sufficient market demand. Local government agencies and non-profits leverage these maps for resource allocation, assessing areas with high needs for new services like healthcare clinics or community centers. Furthermore, real estate developers often rely on population radius maps to gauge the viability of new residential or commercial projects, considering the surrounding population density and growth trends. This capability to visualize and analyze localized data makes the population radius map an invaluable asset for strategic planning.
The power of a population radius map lies in its ability to transform complex demographic statistics into an easily digestible visual format. Rather than sifting through extensive census reports, users can quickly generate a map that highlights key data points within their area of interest. This efficiency is particularly beneficial for US users who need rapid insights for decision-making processes. Whether you are a local guide researching community dynamics, a marketer refining campaign targeting, or an urban planner assessing infrastructure needs, a population radius map provides the clarity required. It empowers individuals and organizations to make data-driven choices, ensuring that their efforts are aligned with the actual demographic landscape of their chosen radius.
Why US Residents Need Population Radius Maps
For individuals and organizations across the United States, population radius maps offer practical advantages that directly impact local strategic decisions. Local guides, for instance, can use these maps to identify areas with a high concentration of specific demographics, such as families with children or retirees, to recommend relevant local businesses, parks, or services. This precision allows local guides to tailor their recommendations more effectively, making their insights more valuable and resonant with diverse community needs. Small businesses aiming to expand or optimize their presence can clearly see where their target customers reside, guiding decisions on advertising placement, product offerings, or even where to open a new branch. This immediate demographic snapshot is a game-changer for localized market analysis.
Community development and urban planning initiatives throughout the US greatly benefit from the granular data provided by population radius maps. Planners can assess the population density around proposed public transportation routes, new schools, or essential service hubs like fire stations. This data ensures that new infrastructure projects are strategically located to serve the maximum number of residents efficiently. Organizations focused on social services can identify underserved populations within specific radii, allowing for targeted outreach and resource distribution to areas most in need. By visually presenting population distribution, these maps help stakeholders understand the demographic landscape, fostering more equitable and effective community development, which is a key consideration for sustainable growth.
Moreover, the utility of population radius maps extends to emergency preparedness and public safety planning in the United States. During natural disasters or public health crises, authorities can rapidly identify the number of people living within an affected radius, informing evacuation plans, resource deployment, and communication strategies. This immediate understanding of population density and distribution allows for a more efficient and targeted response, potentially saving lives and mitigating damage. From local zoning board meetings to comprehensive city planning, the population radius map empowers US decision-makers with crucial information, fostering informed discussions and leading to better outcomes for communities. It transforms abstract numbers into actionable geographic intelligence.
How to Create Your Own Population Radius Map
Choosing the Right Online Tool
Creating your own population radius map for a US location is straightforward with various online tools, but selecting the right one is the first critical step. Several platforms offer this functionality, ranging from free, basic options to more robust, subscription-based services. Free tools like some available directly through Google Maps extensions or specialized websites often provide fundamental population counts within a given radius, perfect for quick personal research or simple local inquiries. These are generally user-friendly, requiring only an address and desired radius. However, their data depth might be limited, focusing primarily on total population and household counts. For many US local guides or small business owners starting out, these free options provide an excellent entry point into demographic analysis.
When your analytical needs for a population radius map extend beyond basic population figures, you might consider more advanced, often paid, online tools. Services like ArcGIS Business Analyst Online, PolicyMap, or various commercial GIS platforms offer comprehensive demographic data, including income levels, age distribution, consumer spending habits, and detailed ethnicity breakdowns within your specified radius. These platforms typically integrate with extensive US census data and proprietary datasets, providing a much richer picture. While they involve a subscription or per-use fee, the depth of insight gained can be invaluable for detailed market research, large-scale business planning, or in-depth community studies. Evaluating your specific data requirements will guide your choice between a free and a premium tool.
To ensure you choose the best tool for your population radius map needs, consider several factors beyond just cost and data depth. Ease of use is paramount; a complex interface can hinder efficient analysis. Look for platforms that offer intuitive map controls, clear data visualizations, and straightforward export options for your findings. Additionally, verify the data sources and currency. Reputable tools will clearly state where their demographic information comes from, typically relying on the latest US Census Bureau data, American Community Survey, and other reliable statistical sources, ensuring your insights are current and accurate. A quick online search for
Population radius map benefits, how to create a population radius map, best free population radius map tools, understanding population density maps, population radius map requirements, finding a population radius map tool near me, population radius map data, what to expect from population radius mapping

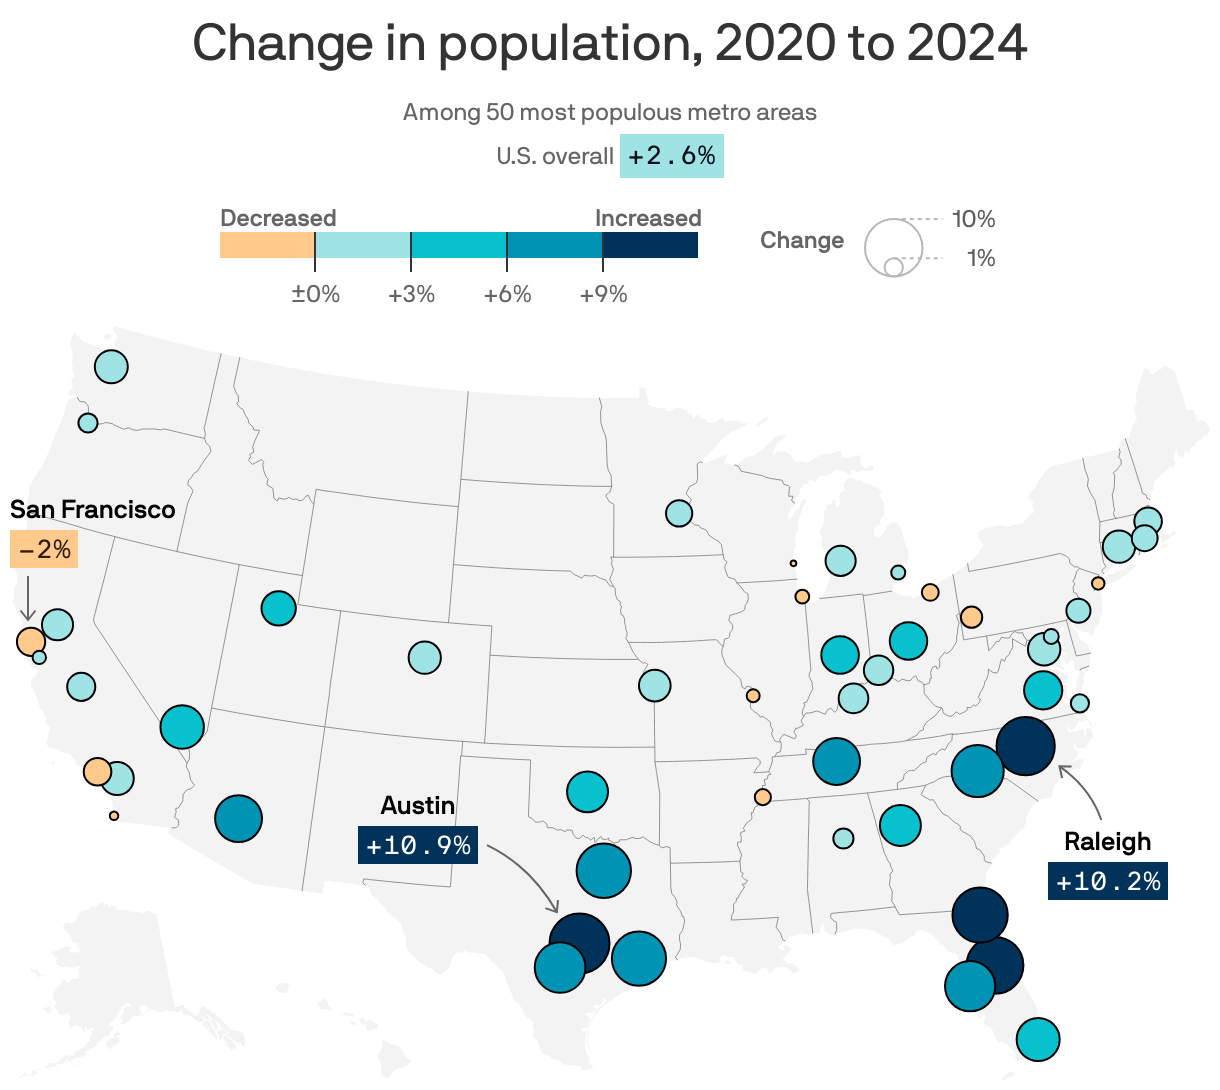

World Population 2026 Worldpopulation Digital 2026 Global Trends Datareportal Map 20251013 2026 Overview Report POPULATIONMAPDATAREPORTAL20251013DIGITAL2026GLOBALOVERVIEWREPORT Richmond Metro Area Sees Spike Thanks To Immigration Axios Full Radius Tool Maptitude Mapping Xradius Choropleth Pagespeed Ic 7MLWBFQJUW Calculate Within A 4H0FLAXFMZ5ORGIPSNGMSOXCE Census Bureau Announces Sites For 2026 Test Feature 2026 Canada Pyramid 2026 Populationpyramid Net Pop Growth India S Distribution By State In 2025 U 2026 Press Kit 2026CT National Large 2026CT Of Density Day Vector De Stock 1000 F 515424876 TC4FMWCG0MIKJE7TLTG7USITBQ2WG4IT 1000 515424876 TC4FMWCG0MIKJE7TLTG7USITBQ2WG4IT Us Heat XFPU GEW2QVFE6H511 Showing Usa GMCRXG Change.



India S Population Distribution By State In 2025 Wise Vegetarian 2026 Census Test Press Kit 2026 Asian Countries List Capitals 2026 Flags Map Best Space A Routes For Cat VI Travelers 2026 Route Sub Featured World 2026 Billion And Key Trends 2026 This Interactive Is Tons Of Fun It Calculates Around Fossjipxsaebduo US Guide The United States Density Heat 2026 Agriculture Underway Okotoksonline Com Local News 2026 2024 COUNTY ESTIMATES RELEASED Percent Change Comparison 2026 Area Flag Youtube Maxresdefault ADP Radius Ring Scaled Changing Demographics 2026 Analysis Hindu Share Foreign Born Nationals 2026.

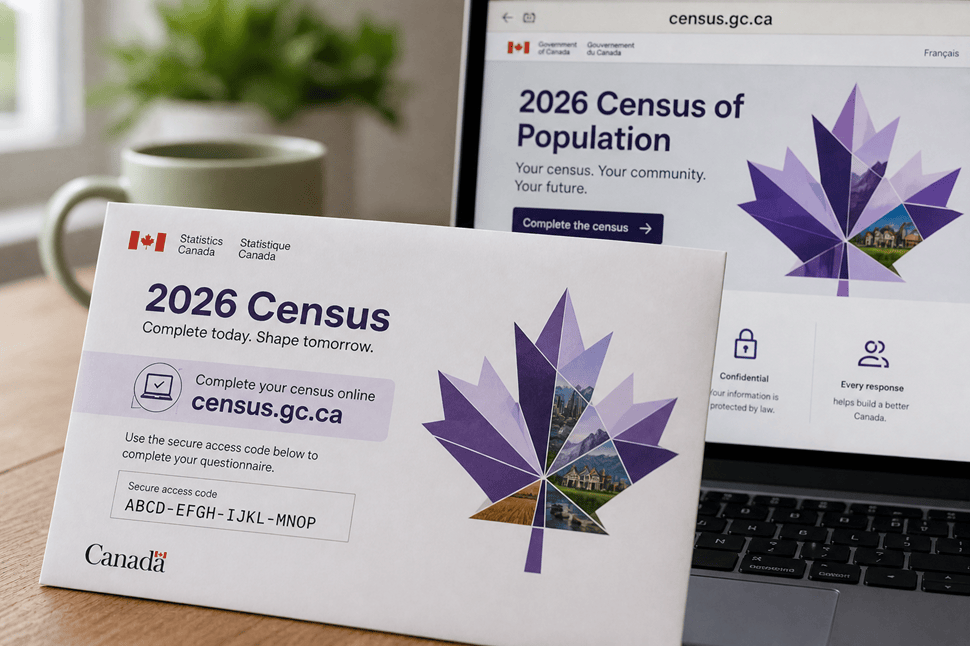

Alaska Population Density Graph 38057323 WEB1 Populationdrop JUE 241204 38057323 WEB1 241204 State Wise Mob Lynching Incidents In India 2025 Muslim Of 2026 Census Collection Begins This Week Across Canada Calculate Within A Radius Map Tool 7IVWOHFZBXCEZYHLPXZY7BLK0A ABS Starts National Recruitment Drive For 2026 Field Staff And Aus E1770091261829 Pyramid 2026 Populationpyramid Net Preview World 2024 E9C753037BA9FE7CA678F21ED5A49BFC Paris 2026 Facts Demographics Q90 How The D C Area S Has Changed Since 1970 UHTFQI US Change 1961 2026 Ranking By Region Chart Regions MUCMV United.